Brain Imaging - Clinical
As part of clinical practice and longterm research protocols, many biomedical researchers acquire large databases of diagnostic images. These images are used as part of prospective observational studies to learn about the etiology of disease as well as for comparisons between disease subtypes and treatments. Large clinical imaging databases provide an unique resource for informing research and treatment. However, the scale of data and the heterogenous nature of their acquisition makes analysis complex and inference difficult.
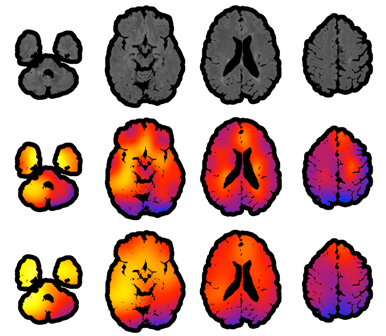
Our group's interest is in creating robust, scalable, generalizable methods for informing clinical practice and research from large neuroimaging databases. One of the first things that one learns when entering the area of high resolution structural brain imaging is that images are very pretty, but that the actual numbers behind the images are actually quite difficult to work with. For example, in structural MRI data are expressed in something very exotic, AU. The first surprise is that AU actually means "arbitrary units", which can vary wildly between scans, machines, day of the week, etc. This is not a big problems if one is interested in analyzing data for one scan of one subject, but it becomes an enromous problem if one wants to do population level analyses and/or connect brain imaging data with health outcomes. Thus, a fundamental problem is to ensure that numbers mean the same thing. There are probably hundreds of ways of getting pixel intensity values on the same scale. Suprisingly, most methods used in practice do not make much sense. For example, many normalization procedures simply take the intensity of the voxels and subtract the average intensity in an easily identified area of the brain, such as cerebellum. This will center values around the mean intensity of the particular ROI, but will not make AU's become well defined units. Such a method would work well if and only if the difference between scans is simply a shift in mean intensity. Sadly, this is not typically the case. Another normalization procedure extensively used in practice is "histogram matching", which essentially is a quantile matching approach to normalization. The way this works is: the intensities of each of the 2 images are binned in a histogram and then same-probability quantiles are stretched or compressed (like an accordeon) to match. A version of this is to match to a pre-defined or average histogram. This sounds more sophisticated, but it has even more problems than the previous normalization. Indeed, this approach assumes that the two images will have roughly the same distributions of white matter, gray matter, bone, skull, blood vessels, ventricle size, etc. Much more serious, though, is that in the case of brains with stroke, cancer, traumatic brain injury, or multiple sclerosis, this normalization procedure would assume that the diseased area of the brain is roughly similar among subjects, and, sometimes, similar to a template obtained from healthy subjects. This leads to "feature distruction" because subtle changes in intensities in disease areas are squashed using a Procrustean approach.
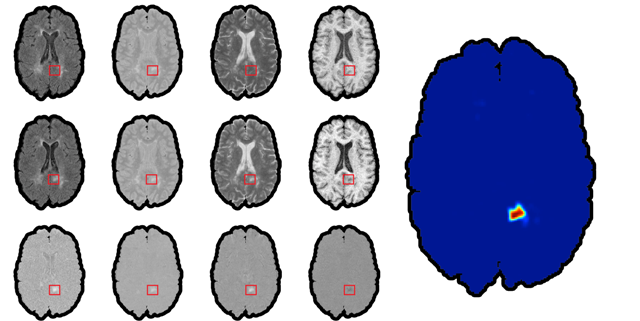
We have introduced a very simple normalization procedure that ended up working extremely well (=robustly across heterogeneous images) for lesion segmentation.


