Brain Imaging - Prediction
The SMART group has many parallel efforts in using brain imaging for prediction. This includes efforts to produce better, more biologically motivated predictors as well as efforts in parsimonious prediction based models.
One notable accomplishment was the group's winning of the ADHD global prediction competition. Here, SMART group members used several processing and analysis methods to produce diagnostic predictions of ADHD and subtypes. A particularly pertinent relevant predictor involved motor network correlations from a parcellation obtained by Mary Beth Nebel of the KKI LNIR lab, which is closely aligned with the fMRI efforts of the SMART group.
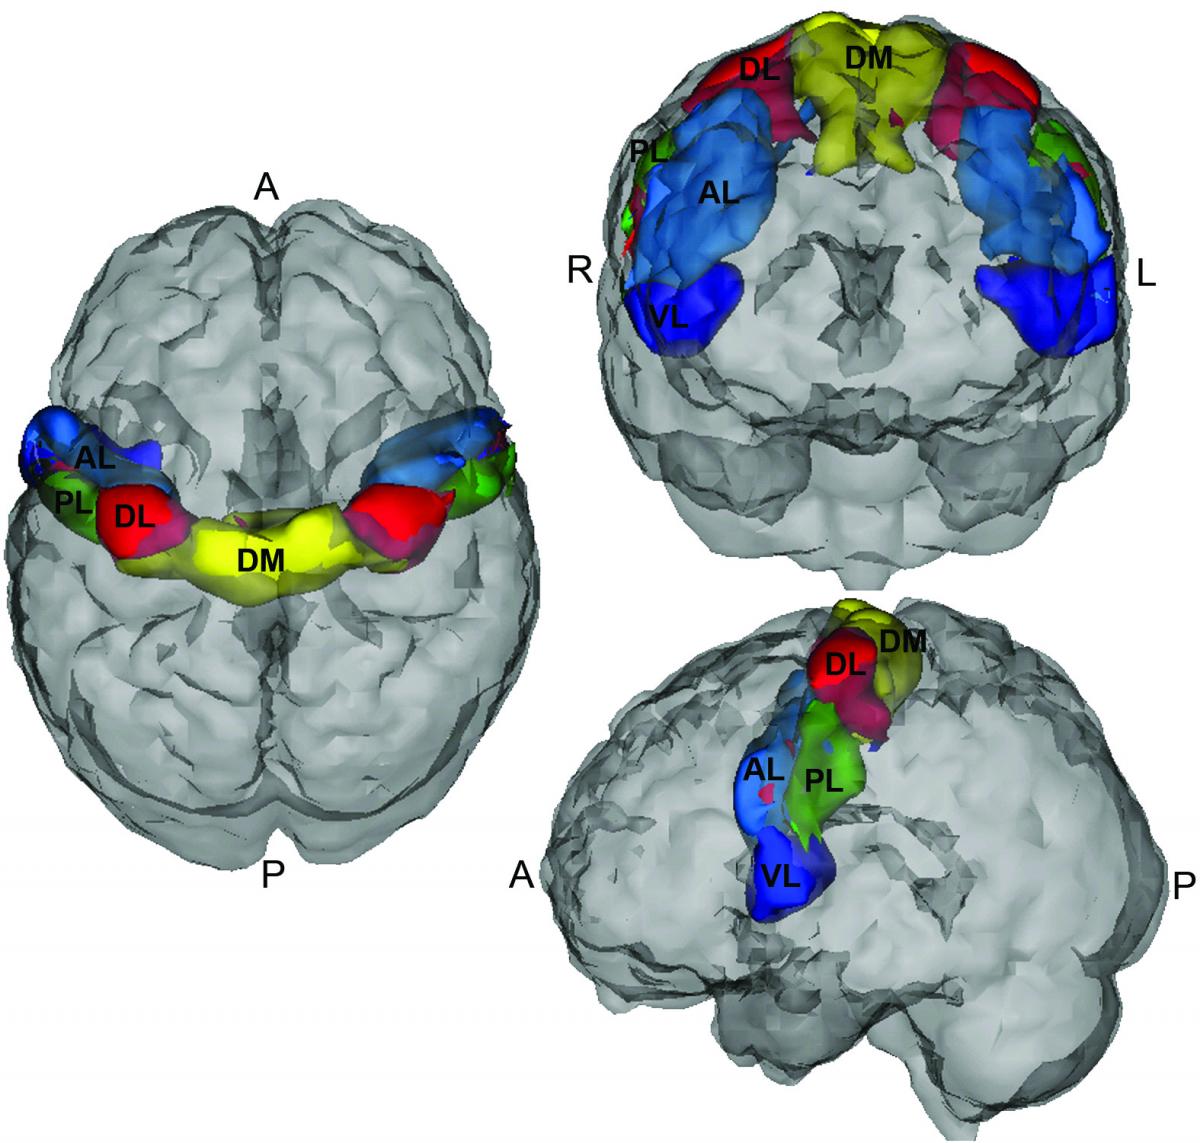
Correlations between motor network areas had a significant association with ADHD subtype. In particular, resting state correlations between the dorso-medial and dorso-lateral parcels showed promising evidence of association with ADHD subtype. A second interesting development from this competition is a novel use of the CUR decomposition on resting state data to discover common directions of subject motion. Of note, this method appears to detect very subtle population directions of motion, even after motion has been directly addressed in processing.
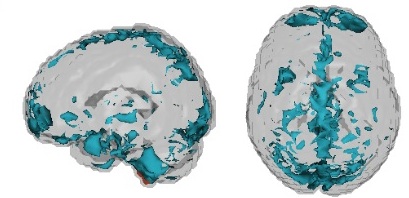
These results will be discussed in an invited submission to Frontiers of Neuroscience.
Diagnostic images acquired either as part of clinical practice or in the course of long-term studies provide the opportunity to analyze the associations between anatomy and clinical outcomes. Although it is intuitive to consider the voxel-level observations contained in an image as comprising a unified anatomical observation, the size and complexity of images as predictors prohibits the direct application of standard regression modeling techniques to uncover relationships in the data. Commonly used mass-univariate approaches to inferring associations between complex predictors and clinical outcomes can be a good exploratory approach, but may provide highly misleading information by neglecting to adjust for the potential confounding effects of the hundreds of thousands of voxels contained in an image.
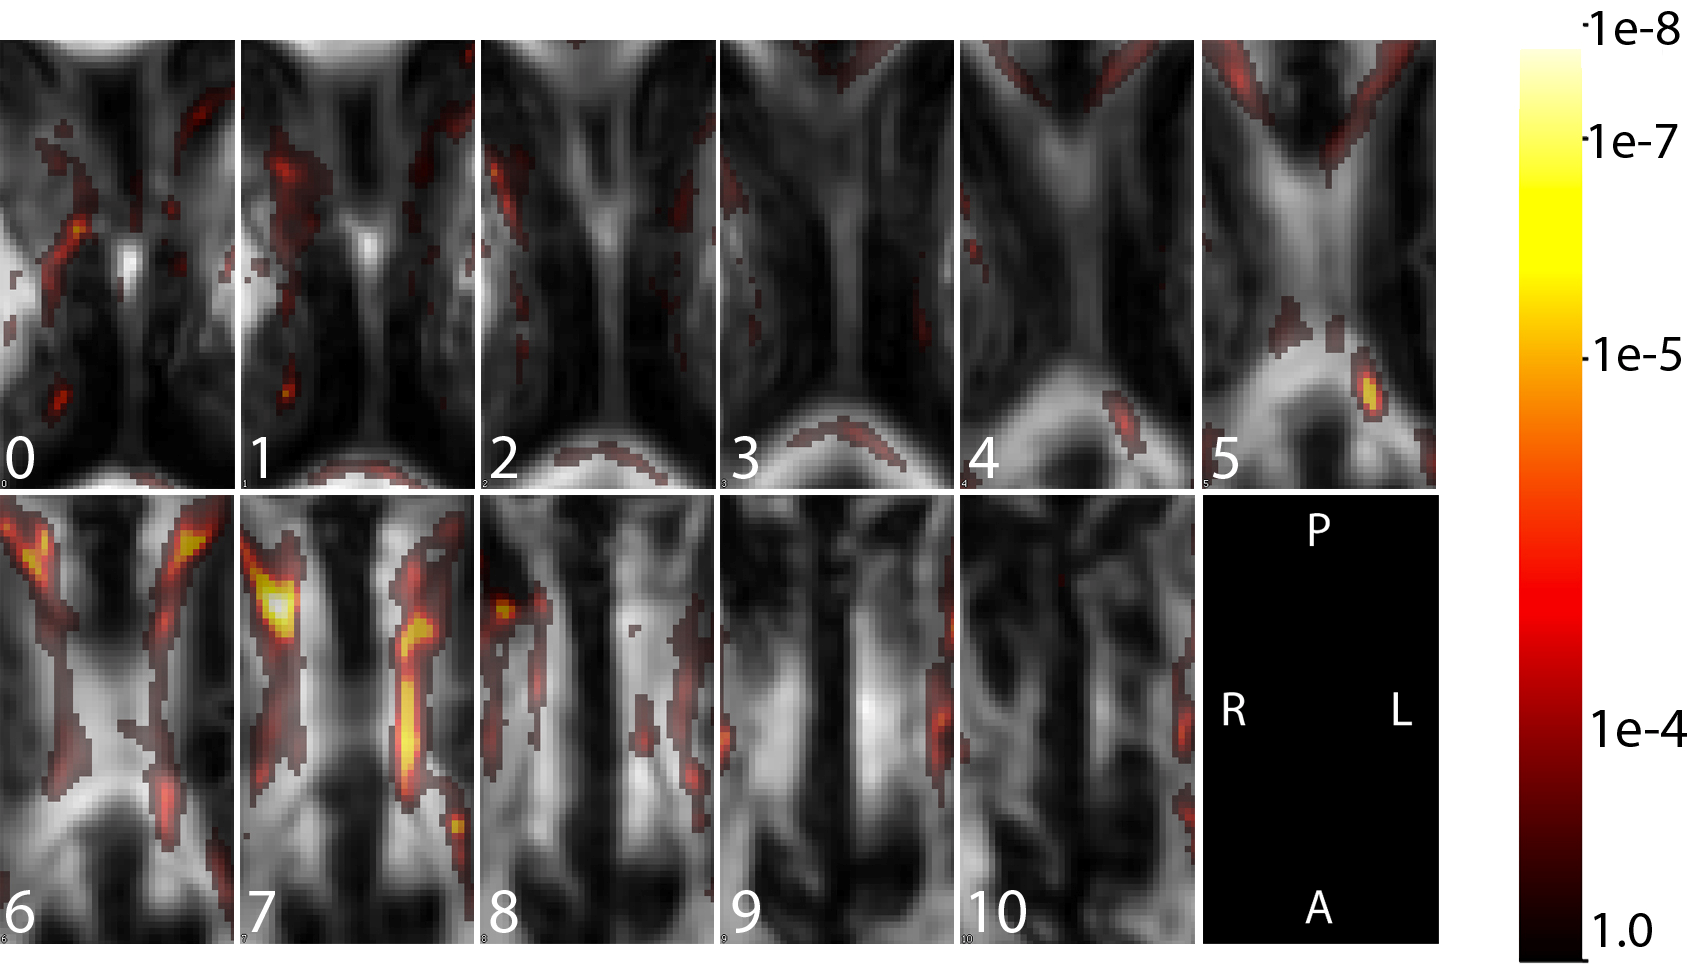
The figure above illustrates the hazards of mass-univariate approaches to studying the relationship between images and outcomes. In this example we examine the relationship between white matter microstructure in the corpus callosum measured using fractional anisotropy in a diffusion tensor imaging MRI (DTI-MRI) and cognitive function, measured using the paced auditory serial addition test (PASAT). We used a dataset consisting of 135 MS patients with image predictors containing 38×72×11 = 30,096 voxels for each subject. The map of p-values that result from voxel-by-voxel simple linear regression models is overlayed on a single subject's scan for anatomical reference; this image indicates that many regions of the CC are related to changes in the PASAT score. The problem here is that massive and obvious confounding (voxels belong to the same brain) is essentially ignored. Below we provide the same results for a more difficult, but principled, analysis of the same data set.
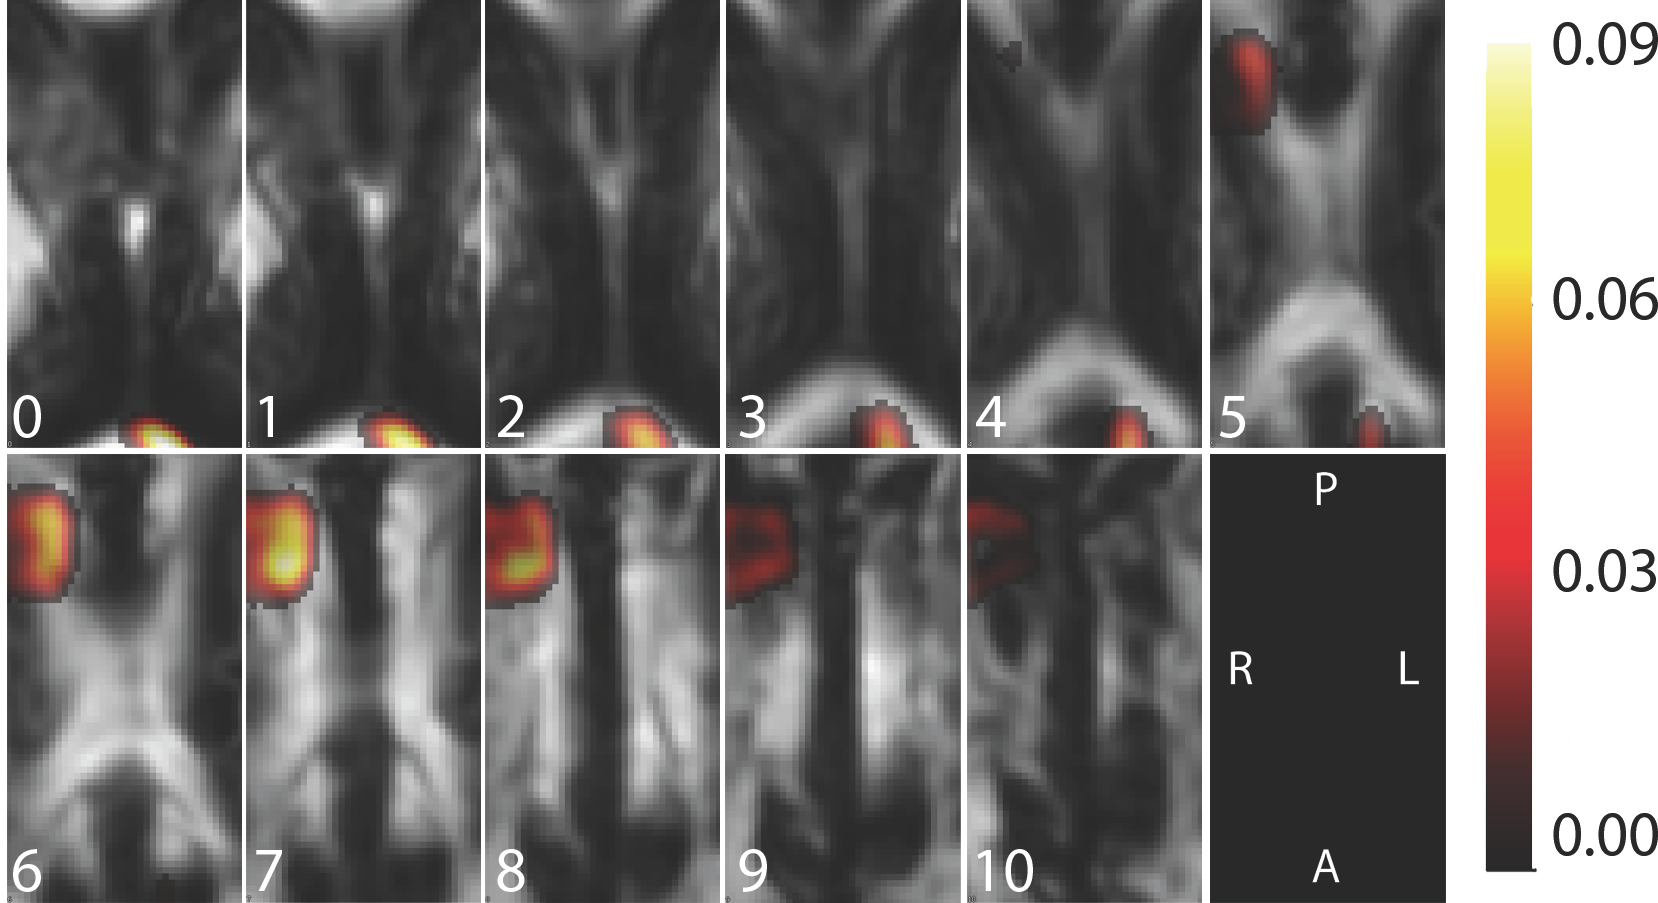
Preliminary work led by Jeff Goldsmith has focused on models that correct for other-voxel-confounding. The p-value map above provides the result of such an analysis, which are vastly different from the ones obtained using a voxel-by-voxel regression. Note, that some parallels exist between the two results (note the higher effect sizes in the upper left corner of slices 6, 7, and 8.) However, the spatial distribution of estimated effects and the size of the p-values is very different using the two approaches (the latter seems to provide larger, and more realistic, p-values.) To increase our comfort with these results we calculated the subject-specific fractional anisotropy in the region identified as non-zero (non gray colors). We then regressed the outcome on these subject specific means and obtained residuals. We then regressed these residuals using a voxel-wise regression and displayed the results below.
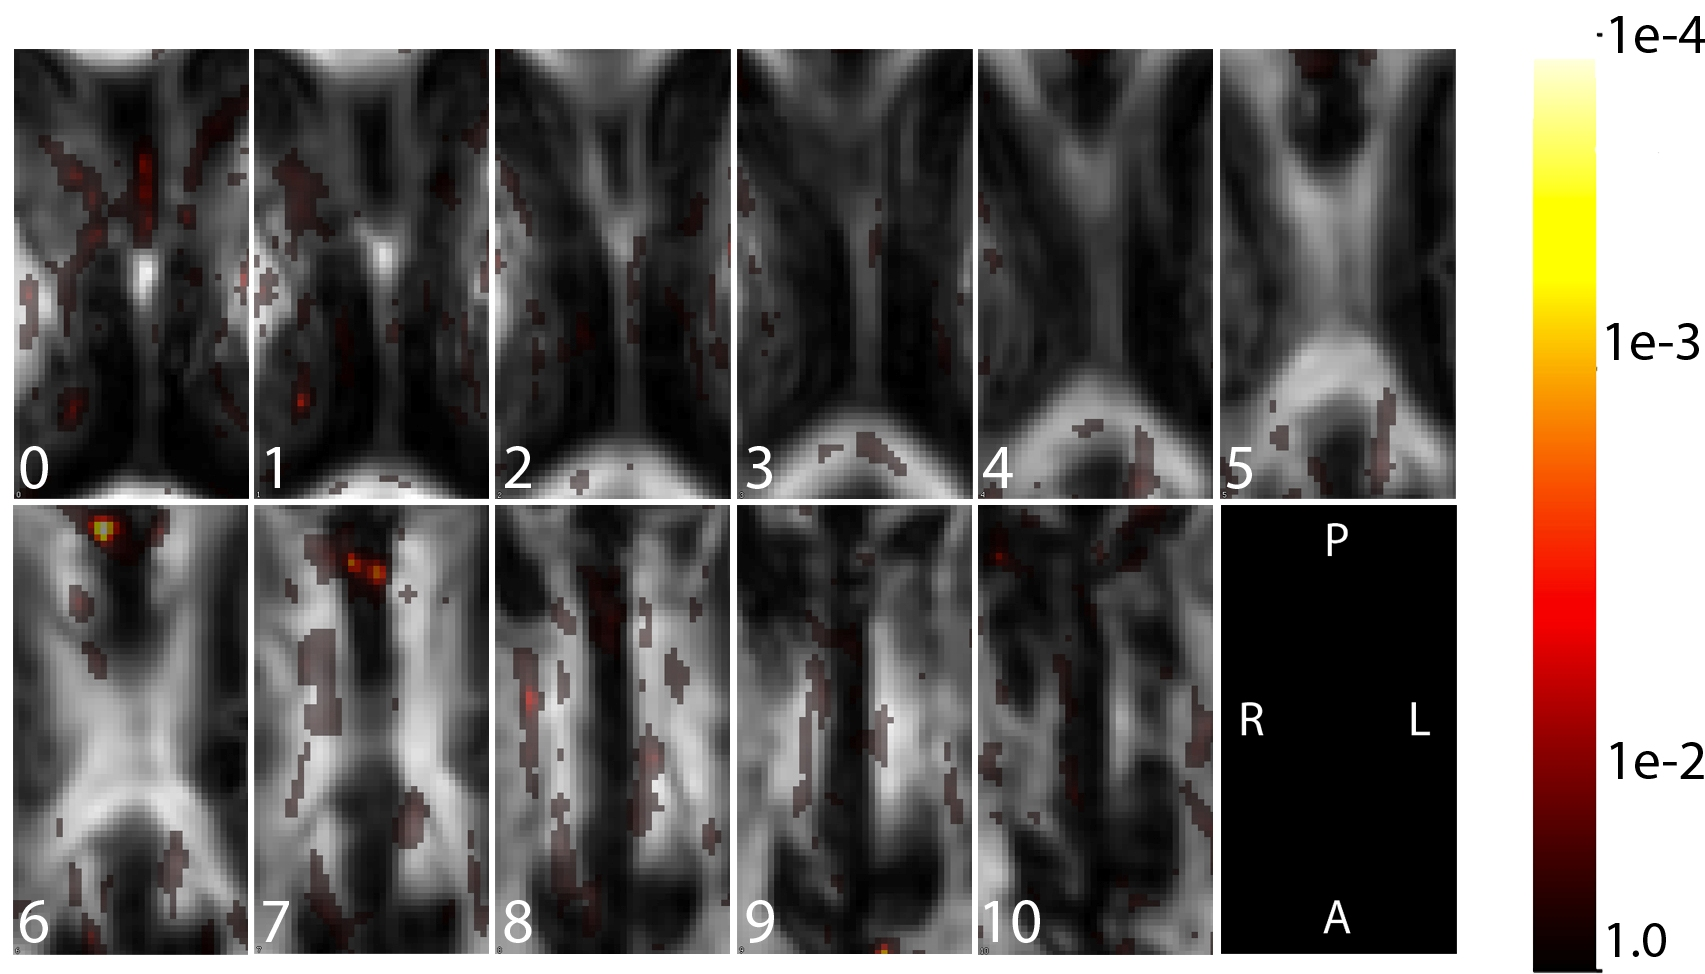
The figure above displays the map of p-values that result from an adjusted analysis, in which the effect of a single voxel is modeled after adjusting for the anatomical region with the highest association with the outcome; this analysis indicates that after adjusting for a single region, remaining voxels contribute little additional information regarding the outcome (note the much increased p-values).

